
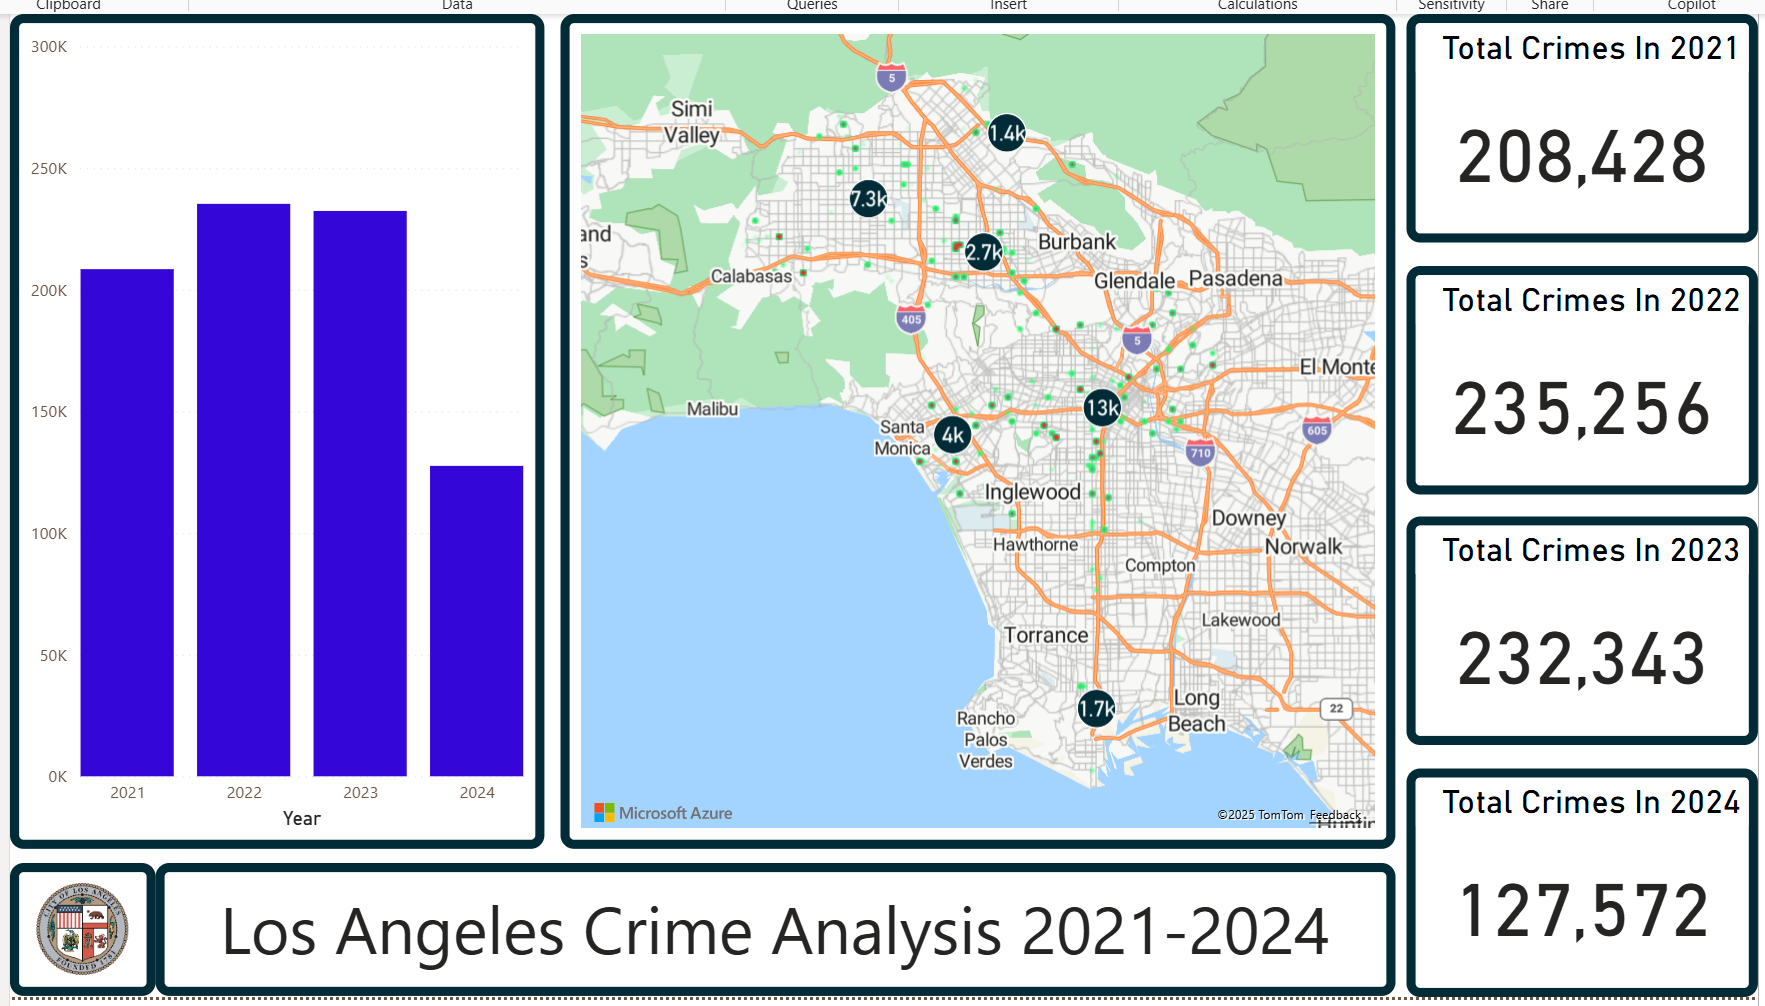
Los Angeles Crime Analysis
A Data Science Project by Gregor Hudson Gregor’s choice of project was to investigate data about crime statistics in LA. He used 1,000,000 rows of data, and created 5 dashboards which are pretty much faultlessly designed. Incredibly professionally designed Power BI Report
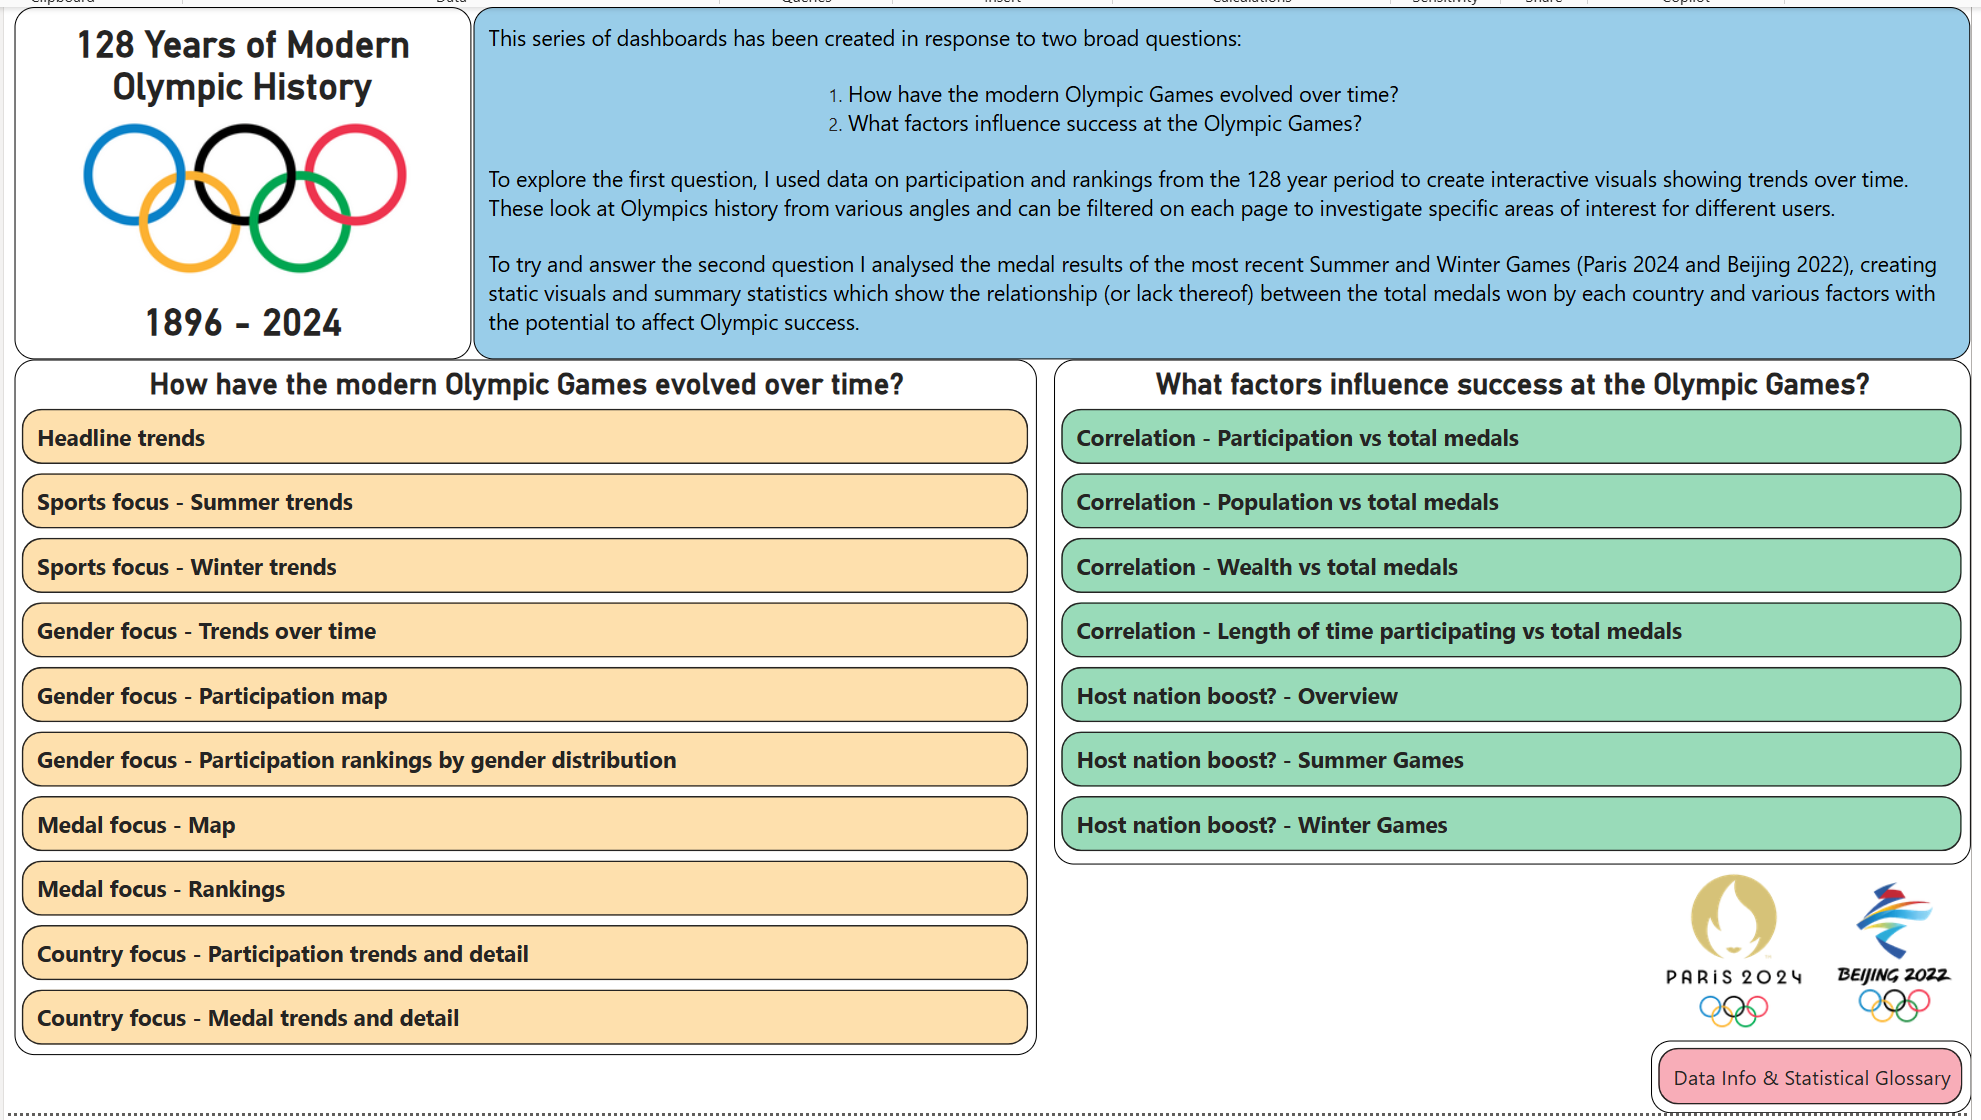
128 years of modern olympic history
One of our Data and Digital Innovation students Clara decided to investigate the Olympics by answering 2 questions: 1) How have the modern Olympic Games evolved over time? 2) What factors influence success at the Olympic Games? ...which she did by way of 18 professional dashboards. This one comes with a warning 🙂 ... you may well spend half an hour playing with her dashes - great job

Human Trafficking Investigation
One of our Data and Digital Innovation students Anna picked a difficult but hugely important topic and investigated both human trafficking globally and also the support available in Scotland Very professional finish

Marine Invasive Non-native Species of the UK Coastline
One of our Data and Digital Innovation students Susan investigated the marine invasive non-native species around the UK coastline. A phenomenal amount of work went into this...and there are some fantastic touches such as being able to use the sliders on the port pages to increase radius and investigate the invasive species counted by port. Stunning!

Gender pay gap: SMEs
One of our Data and Digital Innovation students, Susana’s choice of project was to investigate the Gender Pay Gap in the UK with a particular focus on small and medium sized enterprises (SMEs). Great use of some of the add-in visuals from Power BI

Gender pay gap: UK vs Ireland
One of our Data and Digital Innovation students Agata’s choice of project was to investigate the Gender Pay Gap by comparing the UK to Ireland
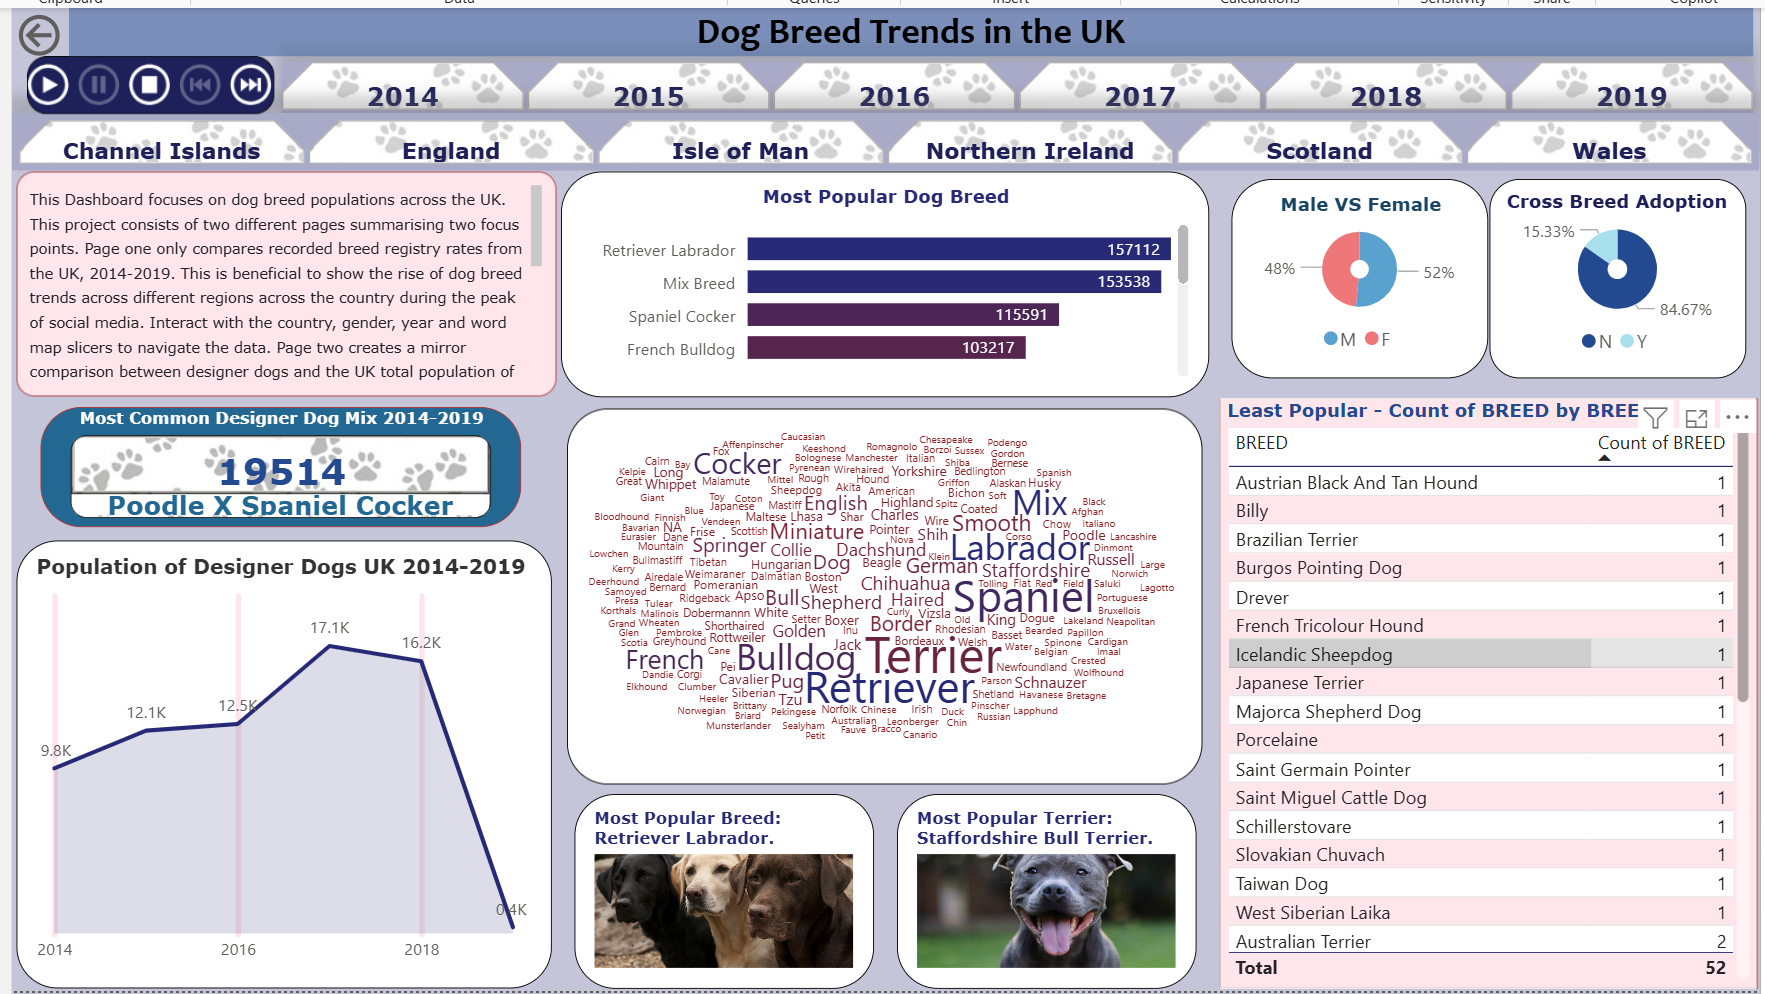
Dog breed trends in the UK
One of our Data and Digital Innovation students Frances Anne's choice of projects was to investigate 30 years of dog breed trends in the UK

UK Road Accident numbers and causes
One of our Data and Digital Innovation students Anusha's choice of projects was to investigate causes and severity of accidents on UK roads

Carbon Emissions data analysed
One of our Data and Digital Innovation students Romeo investigated change in carbon emissions from 1850 to 2021 using data from the United Nations Sustainable Development Goals trackers. Great design throughout and the Play Axis on some of the dashboards, allows the dash to be filtered in real time

Gender pay gap Data analysed
One of our Women in Data and Digital Innovation students Cristina investigated the Gender Pay Gap split by Employer size over 5 years and in addition a breakdown of Births vs Ages of Mothers over a 30 year period. There are a total of 16 dashboards which can be navigated using the tab at the bottom. The Play Axis boards have a dynamic slicer which when you press ‘play’ filters all the charts by Industry.

NHS Data analysed
One of our PDA Students Ryan decided to do his data science project on datasets from the NHS… and it’s REALLY quite impressive. There are a total of 7 dashboards all with a NHS Board Filter to delve even further into the analysis. The pages can be navigated using the arrows at the bottom and it works best on full screen

application of maths - analysed
A Data Science Project by Sara Xavier Sara’s choice of project was to investigate the uptake of Applications of Maths across Scotland

household waste management - analysed
A Data Science Project by Izabela Lipok Izabela’s choice of project was to look at waste management, generated and disposed of, broken down by local authority. A fantastically detailed set of dashboards.

gender pay gap: ukraine vs uk - analysed
Nataliia thought she’d compare the Gender Pay Gap in her home country of Ukraine to that of the UK. She’s broken it down by Age, Industry, Occupation and Region, and has kindly given us the permission to publish it here as an example.
Turning Data Education in Scotland upside down
Offering a flexible alternative to the traditional fixed in-person classes
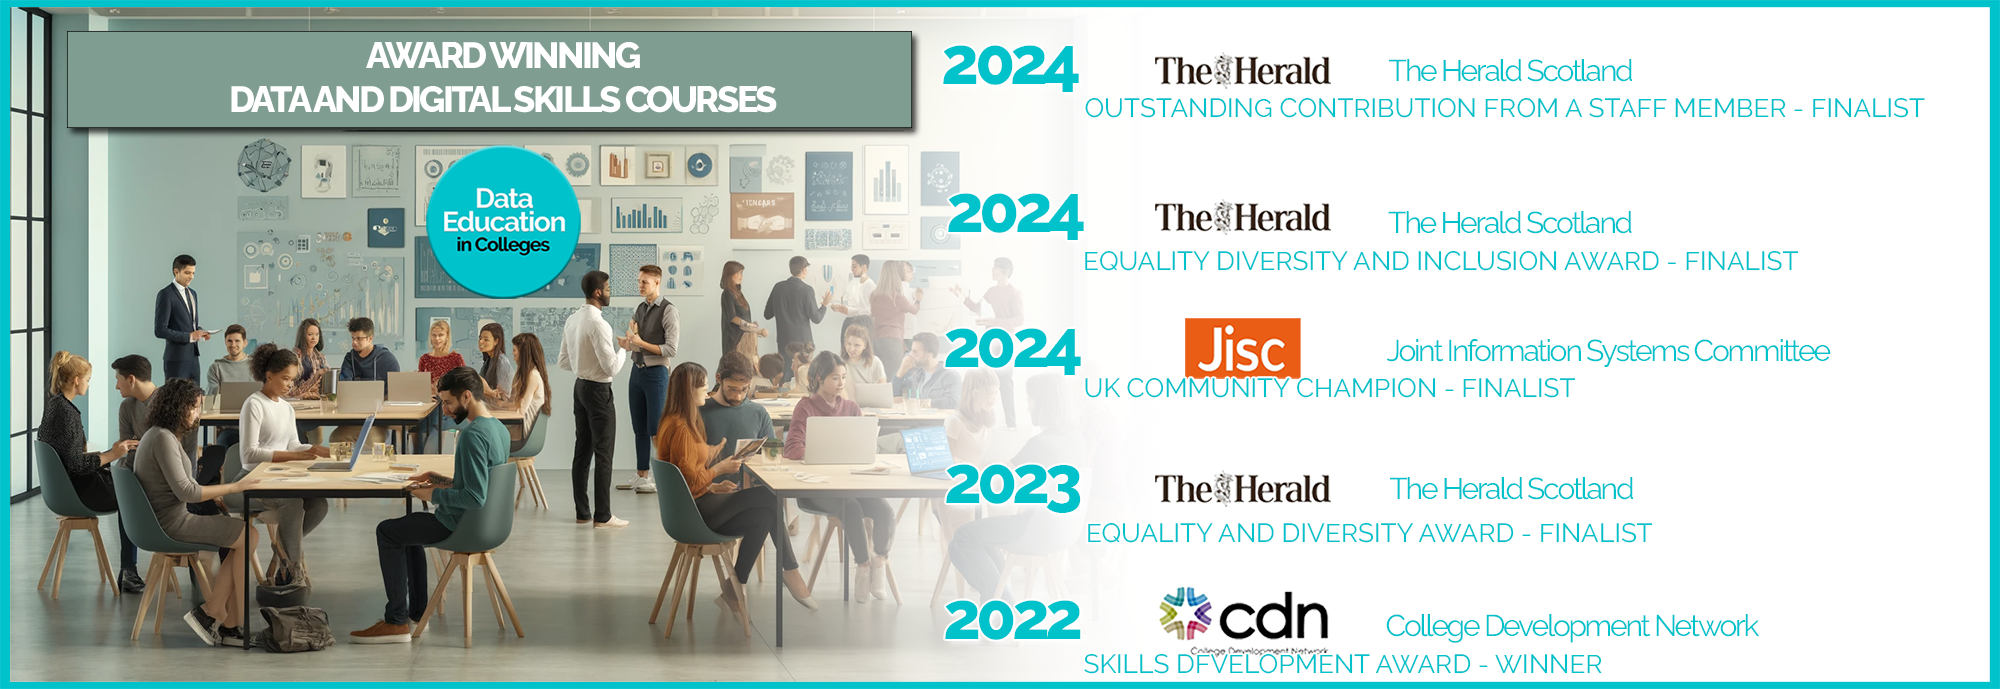
Skills Development Award Winners - CDN 2022
Data Education in Colleges are proud to have been shortlisted for 6 awards - both in Scotland and UK-wide - and won the College Development Network's Skills Development Award in 2022