


Correlation between Education Provision and Economic Wealth


The students in the Data Science with Data Security – aka NPA Data Science Level 5 – were tasked with investigating one or more of the United Nations Sustainability Goals. They were given a free reign to choose a topic from the 17 UN SDGs, and were encouraged to investigate topics which they felt strongly about.
The project had 3 elements – Planning Stage, Development Stage and Evaluation Stage.
The level of commitment and engagement from a Level 5 class was breath-taking.
Excerpt from the Planning Stage for this investigation:
Introducing the UN Sustainable Development Goals – “17 Goals to Transform Our World”
The UN Sustainable Development Goals (SDGs) are a global call to action to protect our planet, end poverty and improve lives for all. These 17 Goals were adopted by all 193 UN Member States in 2015, as part of the 2030 Agenda for Sustainable Development which sets out a 15-year plan and a set of 169 targets to achieve the Goals. A set of 232 indicators are defined which are used to monitor progress in meeting these targets.
Like climate change there is concern that we are not making rapid enough progress towards reaching these goals by 2030.
For more (and one of the best summaries) see: The Sustainable Development Agenda – United Nations Sustainable Development
There are also dedicated websites aimed at enabling people to monitor progress made and datasets are freely available for download by anyone. Some incredible visualisations have been painstakingly (surely?) created at Our World in Data too!
Measuring progress towards the Sustainable Development Goals – SDG Tracker (sdg- tracker.org)
Topics to be explored
Goal 4: Quality Education
Given my work in education I have chosen to look at some indicators of education and to
visualise any geographical variations or inequalities and how these have changed over time.
Obviously many of the data points (years) will be before 2015 however that is an
unavoidable limitation of the approach due to the focus on the SDGs and them being a
recent initiative. We have of course made progress before the SDGs were adopted and it
would be interesting to explore this visually.
Goal 10: Reduced Inequalities
I’ve also chosen to look at an economic indicator to see if there is any correlation (or
similarity in pattern) between education provision (or lack of) and economic health (wealth).
Specific datasets to be examined:
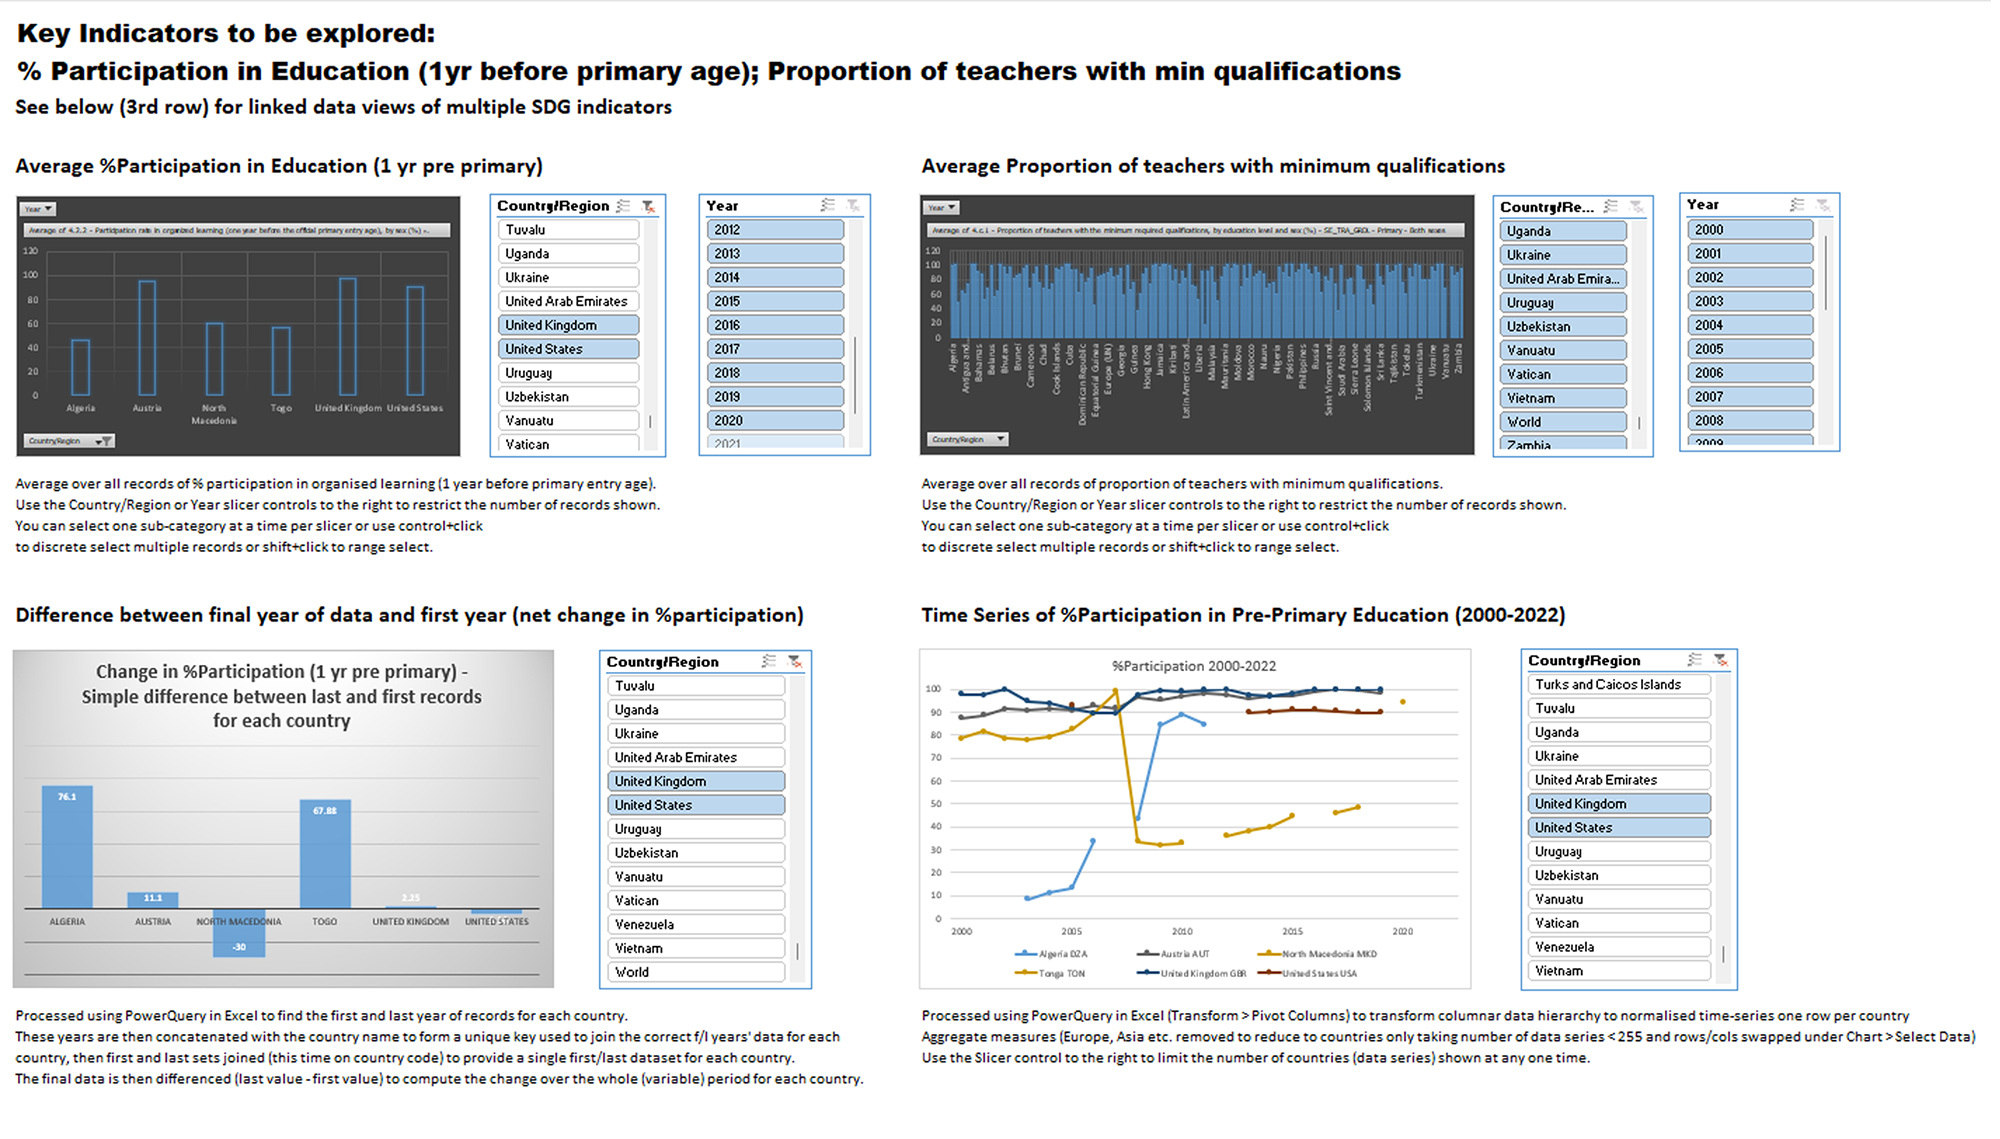
SDG 4.2.2 Participation in pre-primary education:
SDG Definition: “Participation rate in organized learning (one year before the official
primary entry age), by sex”.
Dataset: Net enrolment rate pre primary – both sexes
Rows: 2447
SDG 4.c.1 Supply of qualified teachers
SDG Definition: “Proportion of teachers in (a) pre-primary; (b) primary; (c) lower secondary;
and (d) upper secondary education who have received at least the minimum organized
teacher training…. in a given country”.
Dataset(s): Share of primary teachers qualified
Rows: 1734
(Note: Primary teachers more likely to be qualified than pre-primary though we could look
at pre-primary too which might inidicate advanced educational provision)
SDG 10_2_1 People living below 50 per cent of median income
SDG Definition: “Proportion of people living below 50 per cent of median income, by sex,
age, and persons with disabilities”.
Dataset: Share of population living on less than half of the median income, 2020
Rows: 1674
Total rows: 5855 (admittedly many rows record a different variable for each country)
Why these topics?
These topics are hypothesised to be inter-related. An advanced country/economy should
see a good provision of education including pre-primary school education. Pre-primary
education professionals may however be less likely to hold formal qualifications so a focus
on qualified primary teachers is preferred. Lastly (partly to ensure sufficient data volume at
this level!) it would be informative to look at any possible relationship or correlation
between education and wealth and thus if countries struggling to provide education happen
to have greater numbers of poor people (e.g. more people living on less than 50% of
median income).
Aims/objectives – desired results
We wish to examine the data for trends – either increasing (greater provision of education,
or worsening economic health) or decreasing (worse provision of education, better
economic health). Since the economic data is in opposition we may consider transforming
values on a standard scale in order to derive an economic health index or similar and to
enable easier comparison (trending the same direction on a graph).