


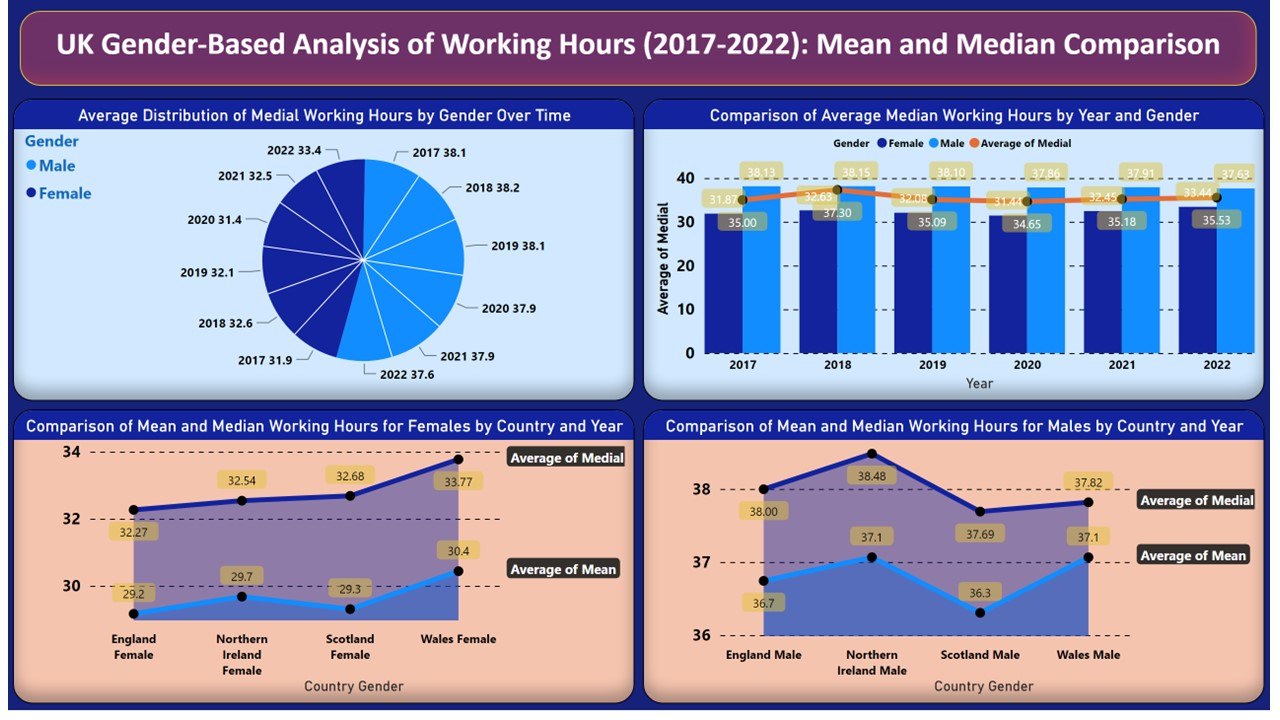
Gender Pay Gap – Mean and Median
The Women in Data and Digital Innovation were given a brief to plan, develop and evaluate a showcase project. They were given a free reign over subject matter, and some of the projects have been nothing short of outstanding.


This is an excerpt from this student’s planning stage:
The UK’s gender pay gap remains a persistent issue, with women earning less than men for the same work.
In 2022, the gender pay gap for full-time employees was 5.45% according to the Department for International Trade (GOV.UK, 2022). Additionally, PwC’s yearly ranking of women’s employment outcomes among OECD countries shows that the UK has dropped from ninth to fourteenth place (PwC, 2023).
This project aims to examine gender-based differences in earnings and working hours.
Clocking Inequality
The gender pay gap may be due to differences in working hours, as men tend to work more hours, and part-time work is typically paid less (Digital, 2019).
Despite efforts for gender equality, a report published by the World Economic Forum estimates it will take 136 years to close the global gender pay gap (Armstrong, 2021).
As a single mother with limited job options, I have personally experienced working long hours for lower pay due to domestic responsibilities.
Beyond Money
Solving the gender pay gap can promote gender equality in the workforce, improve workplace culture, increase productivity, and contribute to the economy by allowing women to invest in their careers. It can also reduce gender-based discrimination and promote social harmony (WE EMPOWER, 2020).
Seeing is Believing
This report aims to provide information to both employers and employees by carefully considering the language, style, and format used. It will utilise visualisations to present data in a clear and accessible manner.
Beyond the Numbers
The human brain struggles to process large amounts of complex information effectively (Stark, 2020). As such, data visualisation is a critical tool in making data accessible and understandable. By visualising data, patterns and trends can be identified that may not be immediately apparent through simple observation.